Content-
The top five economies have driving factors for contracts such as industry trends, land development, emerging markets in subsectors of the economy. The top five populations have some different driving factors for contracts such as housing, construction, infrastructure. Virtually all industries in 2021 incorporate technology. Technology is found in retail inventory systems and point of sale software, contract management software to make contract templates and workflows automated, and more. Demand for certain kinds of contracts overlap economy and population:
Contracts are popular because business transactions will always involve two or more parties. Multiple parties require negotiations, giving something of value to get something else of value, from all parties in a contract. The need for contracts stems from global demands. Each country produces goods and services. Some goods and services are self-serving for growth. Others become sales or exports for profit (or a reduction of debt).
Contracts are as much a part of every company transaction as statistics are a part of GDP (gross domestic product) metrics. Arguably two of the most important methods to measure GDP of a country are “purchasing power parity” (PPP) and “nominal”.
Nominal serves to measure one country to another without regard to cost of living, currency exchange rates, inflation, and deflation. PPP does consider cost of living, currency exchange rates, inflation, and deflation. Nominal GDP considers total output per country. PPP GDP considers the costs of output for one country vs another. PPP considers that the value of a product in one country is unique to the value of the same product in another country. Factors such as logistics, byproducts, storage, and labor affect the value of a product differently based on geography.
As an example, on April 19, 2021, the cost of a gallon of gasoline in USA was $3.208, while the equivalent cost of the same gasoline grade in Iran was $0.227 (also in US dollars). Most of the gasoline used in the United States is sourced from Saudi Arabia. The US does produce oil, but the US imports more oil than produced. Thus, storage of oil, refining oil, transportation of oil and its byproducts, including gasoline, all affect both nominal and PPP metrics for GDP. However, using PPP as a general guideline is going to paint a more complete picture when comparing GDP per country. Because oil imported to the US is refined, stored, transported, and then oil byproducts are sometimes stored again, the cost per gallon of gasoline is higher in the US than in Iran, which is much closer to the source of oil from Saudi Arabia. Also, labor wages are drastically different in Iran vs United States.
Worldpopulationreview.com lists Iran’s annual median income as $12,046 while the United States’ annual median income is $43,585.
Contracts are needed between parties on every phase of oil being purchased, imported, logistics, refined, stored. In the above example, more contracts are needed in the US than in Iran because more parties interact with the process of bring oil to the market and refining it into gasoline to be purchased by consumers.
The nominal metric to determine GDP compares the total dollars of gasoline produced with the formula total gallons of gasoline produced * total dollars generated. The PPP metric to determine GDP uses a formula that is something like this: [(total gallons of gasoline produced * total dollars generated) – (cost to refine + transport + store gasoline) – (inflation in currency) + (debt owed from the country where the oil was imported)] * [(currency of importer)/(currency of exporter)]. Nominal is straightforward and has a simpler formula. PPP has a complex formula. This article includes data based on both nominal and PPP GDP.
The studies below compile data from various sources. The economic study and population study are sourced from worldometers.info and statisticstimes.com. Also included in this article are strategies for contract management based on factors that affect population and economy.
The top 5 economies of the world in 2021 are compared according to the following statistics:

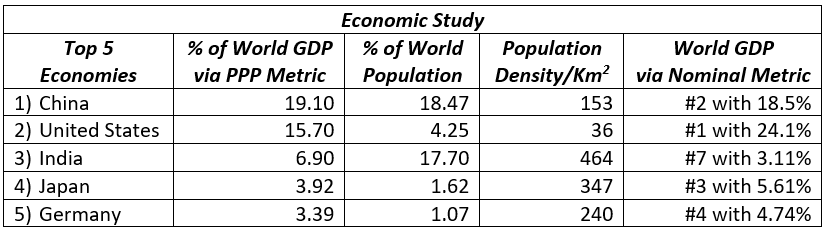
China and the United States are the top two economies of the world regardless of whether measuring by PPP or nominal method of GDP. While both China and the US combine to produce 34.8% of the world’s GDP via PPP metric, and 42.5% of the world’s GDP via nominal metric, China’s population is about four times the size of the US.
China and India are close to the same population with 18.47% and 17.7% of the world’s population, respectively. Yet China’s GDP is far higher than India’s, 2.75 times as high via PPP, and 5.9 times as high via nominal.
All five of the world’s top economies are also the top five sales leaders for the automobile industry. According to carlogos.org, China has been the largest automobile market in the world since 2009. China manufactures automobiles from both Chinese automobile brands and brands that are headquartered in each of the other countries making up the top five economies of the world.
OICA (Organisation Internationale des Constructeurs d’Automobiles, also knows in the US as International Organization of Motor Vehicle Manufacturers), which started in Paris in 1919, lists the top five countries for automobile manufacturing as the same five countries as the world’s top economies.
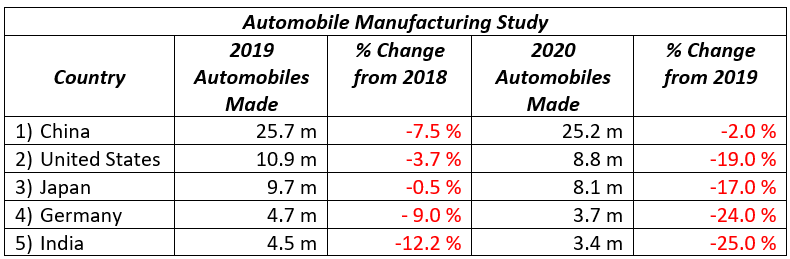
While automobile manufacturing is shrinking in all five of the world’s top economies, other industries are gaining. This means that goods and services are being shifted to other areas of the economy that are more profitable. This also indicates trends for demand, which in turn indicates the types of contracts that are being created and managed in contract management systems.
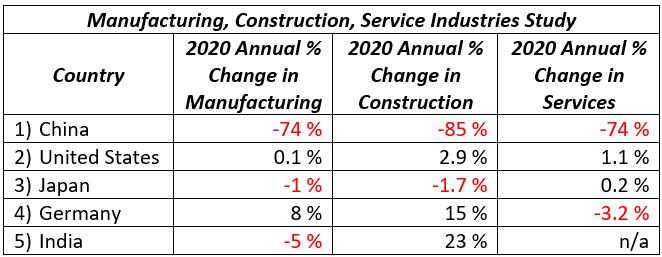
As China has reduced its output from manufacturing, construction, services by 74-85%, other areas of the China GDP have remained nearly flat.
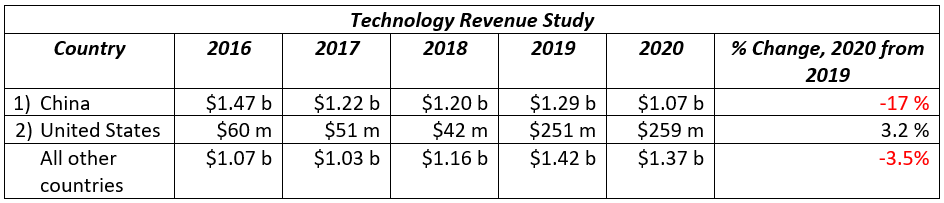
As China’s revenue from technology has decreased by approximately 27% over the period 2016-2020, the decrease in China’s revenue from technology from 2019 to 2020 was 17%. Over the same period 2016-2020, the increase in US’s revenue from technology was approximately 331%, and the increase from 2019 to 2020 was 3.2%.
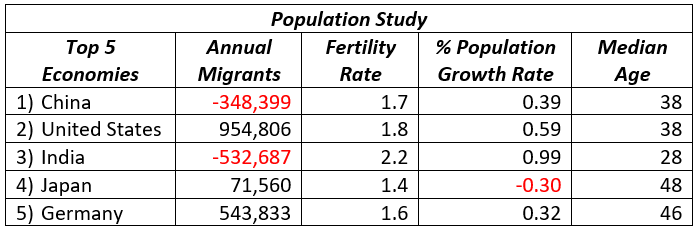
Labor contracts grow in number every year. Countries such as the US, Japan, Germany that have an annual surplus in migrants entering their country have an increasing demand for labor contracts. Each labor contract is subjective to each person. While contract templates are recommended, managing contracts is a complicated process. Using a contract management system is an easier option to manage contracts than to use a manual process.
Contract management systems have built-in workflow processes and alerts. Alerts notify pertinent parties as to the next steps in the contract process.
Imagine being an employer of 500 personnel, each with their own personal credentials (date of birth, ID number/social security number, first date of employment, background check results, and more). Data surrounding each labor contract grows exponentially with each new person hired or fired. Yes, an employer must retain records of past employees as well as current or prospective employees.
The 11 largest country populations in 2020 are listed below, with their 2020 population, and 2012 median household income. Perhaps the median household income from 2012 starts to point towards the contract trends that are present today.
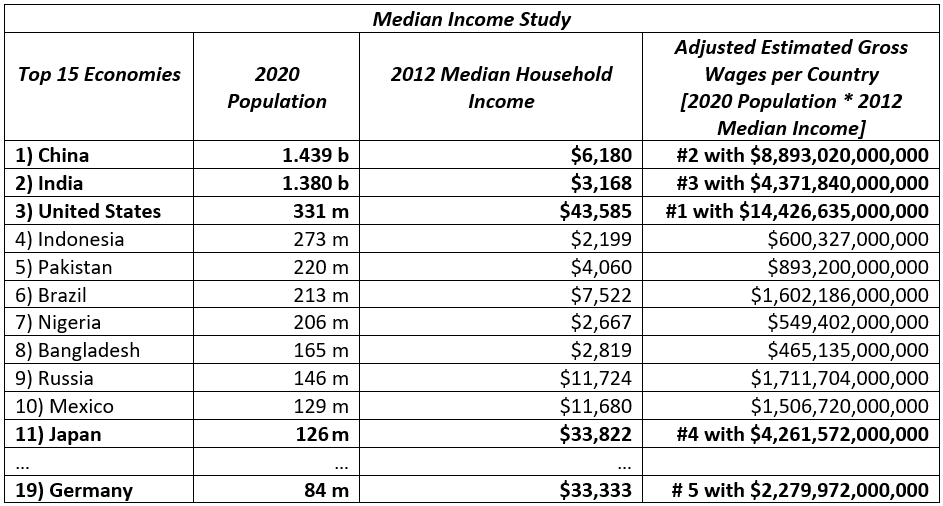
Despite having the third highest population in the world, the US has the highest income per household. When considering median income per household with total population, the US is 62.2% higher than the second-place position, China. As more people enter the US, more people will be seeking employment. This will grow the demand for labor contracts regardless of industry or GDP. GDP is only possible if employees do the work to create the output of goods and services for their employers, and in turn their country.
Labor contracts alone should prompt any organization to purchase a contract management system. Industries will shift from growth to regression in the future as much as in the past. However, employees are diversifying their skillsets to take employment in a myriad of industries, not just a single industry.
Some employees are working two or more jobs simultaneously. Some laborers are moving from full-time W-2 types of employment to two or more contract or temporary or on-call types of employment.
According to the US Bureau of Labor Statistics, the median number of years that an employee stays employed at the same employer in 2020 varied greatly by age. Employees ages 20-24 averaged 1.3 years, compared to 1.3 years in 2012 [trend flat]. Employees ages 25+ averaged 4.9 years in 2020, compared to 5.4 years in 2012 [trend decreasing]. Employees ages 55+ averaged 9.9 years in 2020, compared to 10.3 years in 2012 [trend increasing].
Contract management software includes features such as document repository, contract templates, eSignature, workflow automation, alert notifications, and more. A contract management system is comprised of the contract management software itself and the people who manage and use the software.
Oversight is available on the dashboard of a contract management system. Viewing statistics such as the number of contracts due within 10 days, or expiring in 30 days, or the number of contract drafts awaiting approval from a manager are all part of the capabilities of a contract management system.
Regardless of whether you run a country and are focused on how your country compares to others in the race to the highest GDP, or whether you run a large cap oil company, or small cap logistics company, or run a company of any size along the supply chain of the automobile, oil, technology or labor industries, a contract management system is recommended.