

Ever thought about leveraging Power BI with your SharePoint reporting data? The modern list experience has improved the out-of-the-box views but, it can be difficult to create visual reports, which the users are looking for. What about using Power BI as a game changer? This is the best way for producing visual reports - So, let's go through the basics and integrate Power BI with SharePoint and see what are the possibilities.
For this blog, we have chosen a Marketing Lead Report to populate the data.
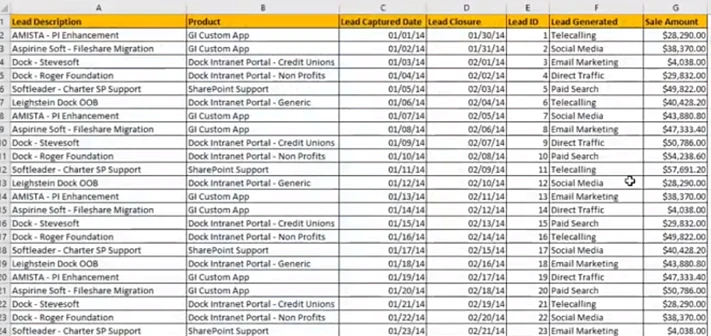
Marketing Lead Report in Excel
This list contacts the Lead Description, Product, Lead Captured Date, Lead Closure date, Lead ID, Lead Generation Medium and the Sale Amount.
I have this in Excel, which I do share with my team for tracking existing leads and closure rates. I kept evaluating the same excel sheet for over three months and that’s when I got a question from our Marketing Coordinator, Jessica Northey: “Sajin, wouldn’t it look nicer with charts? Can we find a way to embed this on our Dock’s Marketing Portal?”
I wasn’t surprised with her question. Why should I keep sharing my spreadsheet with each team members instead of putting it in once place for everyone to see it like a dashboard? Thanks to Power BI, it’s possible!
Watch the video tutorial here:
Now for the sales guys out there, don’t get excited with the sales data I have put above. The company names aren’t genuine and I have just for informational purposes.
I imported the excel data to SharePoint and started maintaining the SharePoint list for my existing Sales and Marketing opportunities.
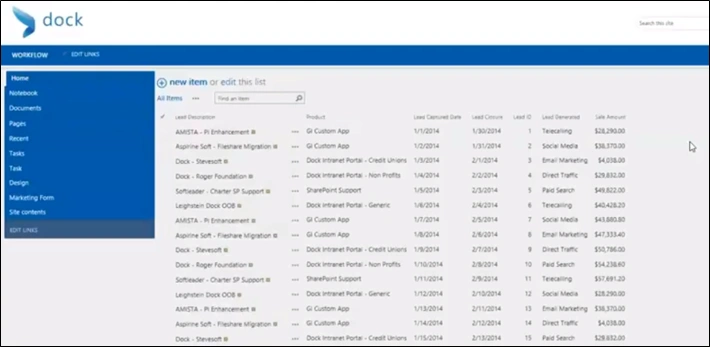
Dock's Sales Portal - Marketing Lead Report List
Great! Now let’s go ahead and integrate SharePoint list data with Microsoft Power BI.
I recommend you use the Power BI Desktop version. Click here to download now.
To start with, let’s copy the URL of the SharePoint list. Open Power BI Application and follow the below steps:
- Under Home, click on Get data.
- Search for SharePoint Online List and click on “Connect”.
- A pop-up appears on the screen. Paste the SharePoint List URL as I mentioned earlier.
- Click OK.
- Go to Visualizations (Right hand side).
- Select your desired reports/charts.
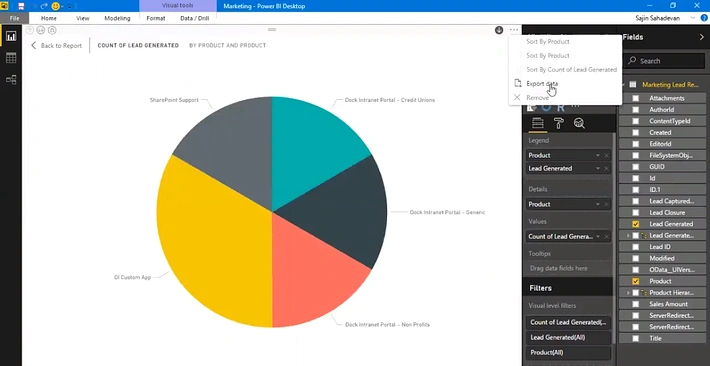
Power BI Interface - Desktop Version
Looks great, isn’t it? The next thing to do is select the imported SharePoint List.
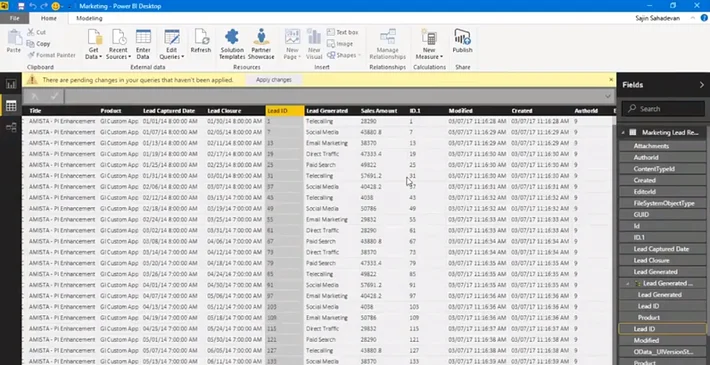
The imported SharePoint List - Marketing Lead Report Data.
Now, select the Values you need to have in the Power BI Dashboard.
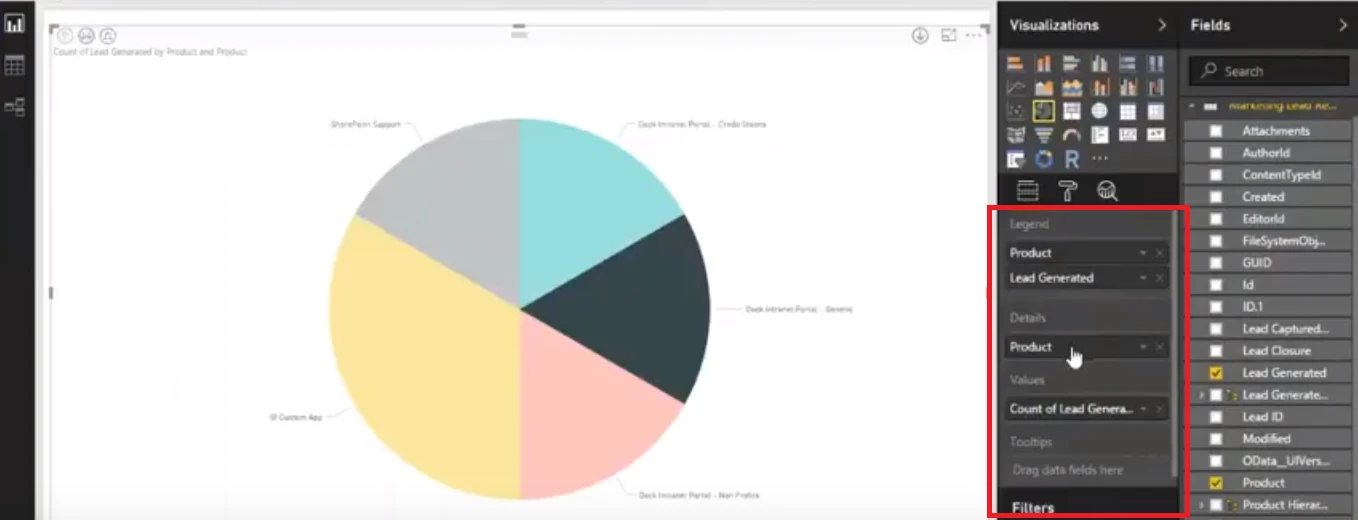
Mapping the values to the Power BI Chart
Under Legend, add Product and Lead Generated Tabs. Under Details, add product and under values, add count of Lead Generated. Now your report is ready to go!
There are lot of visualizations available to download, so feel free to visit www.powerbi.com for more templates.
After setting up the scenario, you get the Pie Chart with the number of leads versus the product and the lead channels.
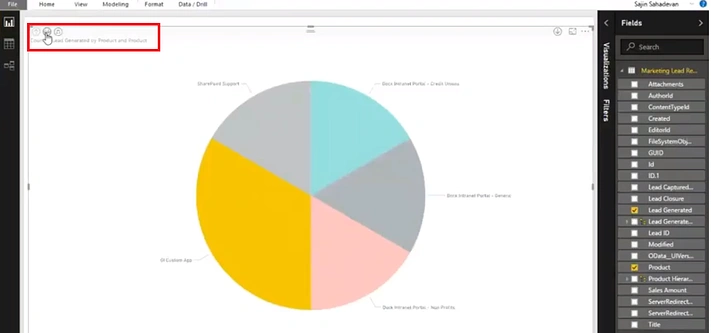
What happens when you click on the second button? It drills down your data to further information!
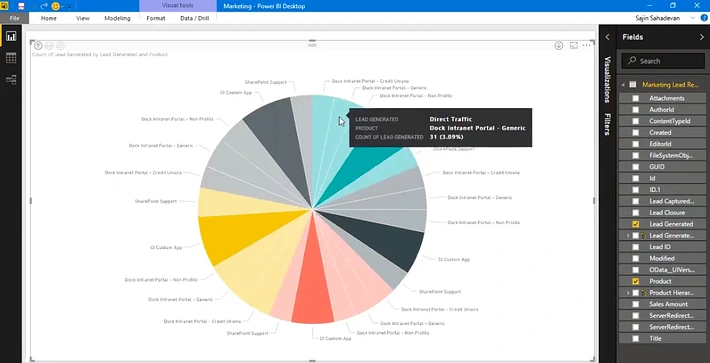
As you can see, the results look great and statistically pleasing report. Next, we publish this chart onto a SharePoint Site so your team can see it without logging into Power BI application.
Most important: “Publish” the changes!
There are two ways to publish Power BI Dashboard on your SharePoint Site.
- As an iFrame in a script editor Webpart.
- You can easily add a Power BI App Webpart.
Almost forgot, you need to have an admin credentials to work on these areas. Also, you need to add user permissions (Adding a contributory permission access is good.) for your list, so everyone can see the data in Power BI properly.
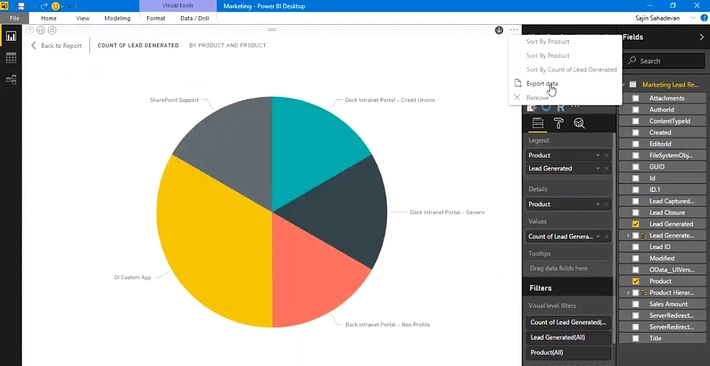
You can also export the data as shown in the image below:
So, want to be a Power BI pro? This is just an initial step of being one! Start using Power BI and create visually appealing dashboards for your organization.
Learn more about how Dock can build your Power BI data charts for you! Schedule a demo with us today.